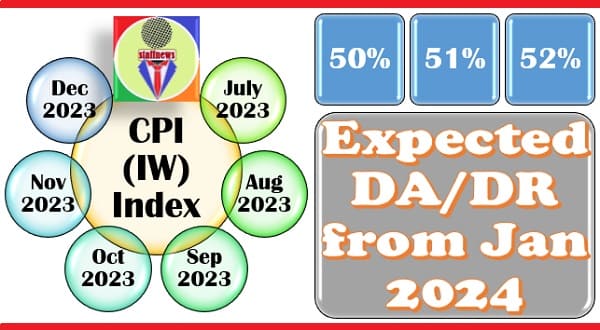
Expected DA/DR from Jan, 2024 @ 50% – CPI-IW for Oct, 2023 released
The All-India CPI-IW for October 2023 increased by 0.9 points and stood at 138.4 (one hundred thirty-eight point four), as per the press release by the Labour Bureau on 30th November 2023. Expected DA/DR from January, 2024 is accounted for in the 4th step with this release. This increase in the CPI-IW Index still results in a 4% increase in DA/DR from January 2024 for Central Government Employees and Pensioners, reaching 50% in the 7th CPC DA/DR. The CPI-IW index in the coming months will confirm the exact figure of DA/DR for January 2024. Expected DA/DR from January 2024 will increase to 50%, subject to further increases in the coming months’ CPI-IW.
The DA/DR from Jan, 2024 table is as follows निम्नलिखित तालिका से समझते हैं कि जनवरी, 2024 से डीए/डीआर की क्या दर होगी:-
Expected DA/DR from January, 2024on issue of All-India CPI-IW for October, 2023 |
|||||||||
| Increase/ Decrease Index | Month | Base Year 2016 = 100 | Base Year 2001 = 100 | Total of 12 Months | Twelve monthly Average | % increase over 115.76 for 6CPC DA | % increase over 261.42 for 7CPC DA | 6CPC DA announced or will be announced | 7CPC DA announced or will be announced |
| Existing DA/DR from Jan, 2023 | 221% | 42% | |||||||
| 0.5 | Jan,23 | 132.8 | 382 | 4489 | 374.08 | 223.15% | 43.10% | ||
| -0.1 | Feb,23 | 132.7 | 382 | 4511 | 375.92 | 224.74% | 43.80% | ||
| 0.6 | Mar,23 | 133.3 | 384 | 4532 | 377.67 | 226.25% | 44.47% | ||
| 0.9 | Apr,23 | 134.2 | 386 | 4550 | 379.17 | 227.55% | 45.04% | ||
| 0.5 | May,23 | 134.7 | 388 | 4566 | 380.50 | 228.70% | 45.55% | ||
| 1.7 | Jun,23 | 136.4 | 393 | 4587 | 382.25 | 230.21% | 46.22% | ||
| Confirmed DA/DR from Jul, 2023 | 230% | 46% | |||||||
| 3.3 | Jul,23 | 139.7 | 402 | 4615 | 384.58 | 232.22% | 47.11% | ||
| -0.5 | Aug,23 | 139.2 | 401 | 4641 | 386.75 | 234.10% | 47.94% | ||
| -1.7 | Sep,23 | 137.5 | 396 | 4659 | 388.25 | 235.39% | 48.52% | ||
| 0.9 | Oct,23 | 138.4 | 399 | 4676 | 389.67 | 236.62% | 49.06% | Expected | |
| 0 | Nov,23 | 138.4 | 399 | 4693 | 391.08 | 237.84% | 49.60% | Expected | |
| 0 | Dec,23 | 138.4 | 399 | 4728 | 392.58 | 239.14% | 50.17% | Expected | |
Previous: Expected DA/DR from Jan, 2024 @ 50% – CPI-IW for Sep, 2023 released
Press release dated 30.11.2023 by Labour Bureau:-
GOVERNMENT OF INDIA
MINISTRY OF LABOUR & EMPLOYMENT
LABOUR BUREAU
Shram Bureau Bhawan, Block No. 2,
Institutional Area, Sector 38 (West),
Chandigarh — 160036
Dated: 30th November, 2023
F.No. 5/1/2021-CPI :
Press Release
Consumer Price Index for Industrial Workers (2016=100) — October, 2023
The Labour Bureau, an attached office of the M/o Labour & Employment, has been compiling Consumer Price Index for Industrial Workers every month on the basis of retail prices collected froni 317 markets spread over 88 industrially important centres in the country. The index is compiled for 88 centres and All-India and is released on the last working day of succeeding month. The index for the month of October, 2023 is being released in this press release.
The All-India CPI-IW for October, 2023 increased by 0.9 points and stood at 138.4 (one hundred thirty eight point four). On 1-month percentage change, it increased by 0.65 per cent with respect to previous month compared to increase of 0.91 per cent recorded between corresponding months a year ago.
The maximum upward pressure in current index came from Food & Beverages group contributing 0.68 percentage points to the total change. At item level, Wheat, Wheat Atta, Arhar Dal/Tur Dal, Cow milk, Egg Hen, Papaya, Pomegranate/Anar, Arum/Arbi, Brinjal, Capsicum, Carrot, Cauliflower, French beans, Garlic, Lady’s Finger, Onion, Peas, Radish, Sugar White, Cumin seed/Jira, Mixed Spices, Cooked Meals, Vada/Idli/Dosa, Bidi, School uniform (Girls/Boys), Leather Sandle, Rubber Chappal, Bus fare, Toilet Soap, Medicine allopathic, etc. are responsible for the rise in index. However, this increase was largely checked by Rice, Fish Fresh, Poultry/Chicken, Mustard oil, Soyabean oil, Apple, Chillies Green, Ginger, Tomato, Cooking Gas (LPG), etc. putting downward pressure on the index.
At centre level, Biswanath-Chariali recorded a maximum increase of 4.8 points. Among others, 4 centres recorded increase between 3 to 3.9 points, 4 centres between 2 to 2.9 points, 19 centres between 1 to 1.9 points and 42 centres between 0.1 to 0.9 points. On the contrary, Chennai recorded a maximum decrease of 1.3 point followed by Coonoor and Kolkata with 1.1 points each. Among others, 13 centres recorded decrease between 0.1 to 0.9 points. Rest of two centers index remained stationary.
Year-on-year inflation for the month stood at 4.45 per cent compared to 4.72 per cent for the previous month and 6.08 per cent during the corresponding month a year before. Similarly, Food inflation stood at 6.27 per cent against 6.52 per cent of the previous month and 6.52 per cent during the corresponding month a year ago.
Read full Press Note View/download the PDF


COMMENTS